

Mindbody // 2023
Data Analytics

Overview
This case study outlines my involvement in making data more accessible to my team using the data analytics tool Pendo. During this initiative, my colleague and I created and implemented a new process for accessing and understanding usage data using this new platform.
The problem
Historically, Mindbody teams used many different analytics tools, each with different processes mapping to different products. With this mix, it was not always clear where and how to find quantitative product data, making it difficult to create, monitor, and iterate on solutions for our customers.

“I'm sure I'm not always using data in the most effective way”
“I spend time trying to figure out what is the tracking tool being used for the product or feature, what is tracked and how (naming, etc), and where I can reference it. I'm sure I'm not always using data in the most effective way. ” – Kat, UX Designer
Goal
Identify and break down the barriers that prevent teams from utilizing data regularly, and equip them with the knowledge, skills and processes needed to function as a data-driven team.
Outcome
Product teams are able to understand customer behavior and leverage quantitative data on a regular basis, enabling them to make informed decisions that solve true user needs and lead to better products for our customers.
The process
Identify the barriers
To start, I set out to understand how teams use data and where exactly they’re getting tripped up. I captured ongoing team conversations around the topic of data, conducted research on best practices for data-driven design, and created a discovery survey to get a pulse for teams’ current relationship with data, the problems they face, and potential opportunities on which to capitalize.

some things worked, many things didn’t.
From my observations and research, I identified three themes to narrow my focus and form my overall approach.
Process
A lot of time is spent tracking down data from various sources and – for designers in particular – it’s difficult to gauge accuracy and relevance of the data.
Perception
Across the board, people understand the importance of data in building a product, from insights to validation and success metric tracking.
Competency
For designers, confident in the ability to effectively interpret data is low, due to the fact that data is not something they use regularly or are familiar with in their their process.
Build the foundation
I formed my approach around process and education. Process covered understanding the tools, identifying team needs, and forming a simple, self-service model of working with data. Education was all about making sure team members not only knew how to use our data tools but also knew what kind of data to pull and why.
One huge pain point from previous analytics tools was not being able to identify specific pages or features within an application. There was no formal process, so it wasn’t uncommon to run into something like mindbody.client.asp/adm_apt?rwdyl7op122/tab2. Determined to never return to that dark place, I created and documented a naming structure that outlined best practices, guidelines, and examples.


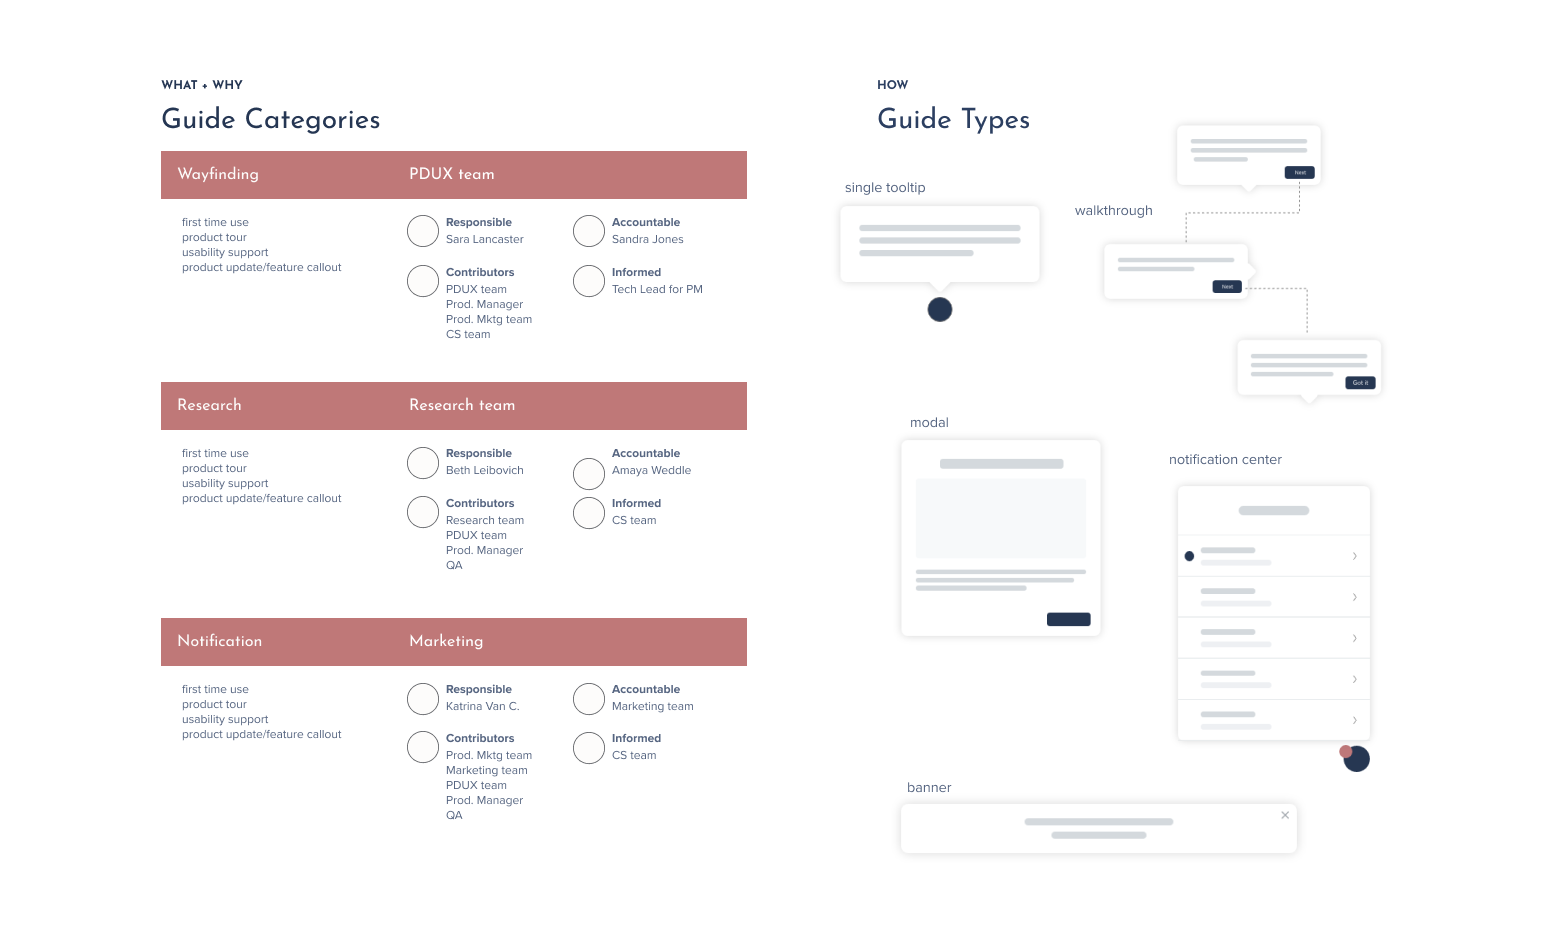
did someone say “in-app messaging”?
In addition to analytics, Pendo also provides messaging features to help with things like onboarding, product communications, feature updates, etc. This caught the eyes of many teams–from Design, to Marketing, to Customer Service, to Product Management–all interested in using the feature in different ways.
To keep up with the demand and maintain a smooth user experience, I worked with key stakeholders to define guide use cases, facilitate the intake process, and also designed reusable layouts so each team could easily create in-app messaging that was consistent and on-brand with our pattern library.
Teach the team to fish
One of Pendo’s superpowers is its self-service capabilities. It encourages anyone to use it and experiment with the data it offers. So I thought, why not teach the team the same way? The resources I created for others, whether it was the naming guidelines, product tutorials, or guide governance outlines, were intentionally organized in a way that communicated the why just as much as they communicated the how. In addition to tangible artifacts, my colleague Beth (Lead UX Researcher) and I held “Pendo Happy Hour” to answer questions and provide additional support across the department.

The results
13 out of 25 products have successfully installed Pendo, with designers, researchers, product managers, product marketers, and developers actively using the platform. In-product messaging has also improved. We have been able to release product announcements, guided tours, and targeted communication to specific audiences without having to wait for it to go through a dev sprint.

Takeaways
In a span of 4 months, I led an initiative to rethink how teams across R&D work with data, including transitioning to a new tool, implementing processes for that tool, and educating on data-driven design. This isn’t a typical product-focused project, doing this work as if it was one (understanding, defining focus, scaling solutions), has had a significant impact across R&D to make data insights more powerful moving forward for everyone.